
In this section, we look at traditional metrics such as Clarivate’s JCR Impact Factor, Scopus CiteScore, Scimago Journal Rank, and h-index, discuss why it might be important to consider this information in choosing a journal, and give tips on where to find this information, and how to understand it.
Citation metrics are one of the most commonly used means of determining journals to submit to. Around the world, academic assessment and graduations are based on publishing in journals indexed in Web of Science or Scopus databases, or in journals with Impact Factors above a certain number.
But what are these databases and these metrics? What can they tell us about the suitability of a journal for a paper? To understand their value, it will be helpful to introduce each of them with some background information.
The Impact Factor was invented by Eugene Garfield and Irving Sher in the 1961 publication of the Science Citation Index, then developed from an author-level metric into a journal-level metric, before entering wide use in 1975 with the publication of the Journal Citation Reports (JCR) Impact Factor.
This metric offered a short-hand means for libraries to estimate the amount of use a journal might expect to get, to help them assess subscriptions. The logic was that the higher the average number of citations the journal received, the more likely it would be to be read and would therefore be worth subscribing to. Since then, the use of citation metrics as a method for assessing the quality or value of research, journals, and especially individual researchers, has been a fiercely debated, controversial issue.
The key metrics you are likely to see presented on journal websites are the Clarivate JCR Impact Factor, Scopus CiteScore and h-index. You may wish, or be required by an employer or funding body, to submit to a journal with one of these metrics.
CLARIVATE WEB OF SCIENCE IMPACT FACTOR
The Impact Factor is derived from citation data held within Clarivate Analytics’ Web of Science Core Collection. As of 2019, the Web of Science (account required) contains nearly 23,000 journals, but only 12,600 of these have Impact Factors. These journals are the 9,200 indexed in the Science Citation Index Expanded (SCIE), and the 3,400 indexed in the Social Sciences Citation Index (SSCI).
Clarivate also produce two additional databases of journals which are not given Impact Factors; the Arts & Humanities Citation Index (AHCI) containing 1,800 journals, and the Emerging Sources Citation Index (ESCI) containing 7,800 journals. The ESCI is the most recent addition to the portfolio of databases, and allows Clarivate to acknowledge a greater number of journals that meet good quality editorial standards, but fall below other criteria to have been included in the primary Core Collection.
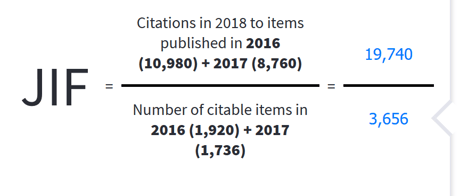
The Impact Factor is calculated as follows: Number of citations in the Year of Interest divided by the number of articles published in the two previous years. For example, citations in 2018 to papers published in 2016 and 2017.
Example
The 2018 Impact Factor for the journal Food Chemistry is 5.399. The calculation is as follows:
Citations in 2018 to items published in 2016 (10,980) + 2017 (8,760)
Divided by Number of citable items in 2016 (1,920) + 2017 (1,736)
= 5.399
Only certain article types will be counted in this calculation, for example, original research and review articles, but not commentaries or letters to editors; however, the total number of citations to any article type are always counted. This means that wherever a citation is made, whether it is made in a 'citable item' (e.g. a review article) or not (e.g. a letter to an editor), the citation would be counted towards the Impact Factor.
Impact Factors are released annually in the Journal Citation Reports, which can be accessed through Clarivate's InCites platform (account required), a separate product to Web of Science. Many indexed journals share their latest Impact Factor on their homepage, so it will still be possible for you to find the Impact Factor even if you do not have access to this platform.
Screenshot from Clarivate InCites of an example Journal Impact Factor (JIF) calculation. https://incites.clarivate.com
ELSEVIER SCOPUS CITE SCORE
Elsevier’s Scopus platform hold the bibliometric data used to calculate the Scimago Journal Rank and the CiteScore.
The Scopus Cite Score is calculated in a similar way to the Impact Factor, but includes the most recent three years rather than two (e.g. citations in 2018 to articles published in 2015, 2016, and 2017).
Unlike the Web of Science Impact Factor, Scopus is one large database, and all journals indexed in it receive an SJR and Cite Score.
SCIMAGO JOURNAL RANK
The Scimago Journal Rank, or SJR, is a more complex metric which attempts to balance the number of citations to a journal with the ranking and importance of the journals from where the citations came. The calculation of the final importance, or prestige, of a journal is an iterative process, in which the prestige in the stage i of a journal depends on the prestige of the set of journals in stage i-1

Equation for the Scimago journal rank indicator. Available from https://www.scimagojr.com/SCImagoJournalRank.pdf
SOURCE NORMALISED IMPACT PER PAPER (SNIP)
The SNIP is calculated by CWTS Journal Indicators, and is also based on Scopus data. This metric attempts to balance the data between fields, so that any one SNIP is comparable to another. It balances the citation impact of journal articles and normalises for differences in citation patterns between fields.
This may not be useful for individual researchers in one field, but can provide a less distorted overview for broader scale assessment by universities comparing each of their departments.
Full details on how the SNIP is calculated can be found on the CWTS website, and in the Waltman et al. (2013) Journal of Informetrics paper where the calculation was published and updated.
H-INDEX
The h-index was designed as a researcher-level metric, but has since been adopted by journals, research groups and other bodies. The h-index is the primary metric given to journals and researchers through Google Scholar metrics, though it is presented through other databases and features prominently in the Scimago journal profile.
The h-index is defined as the maximum value of h where the author has published h papers that have each been cited at least h times.
Example
An h-Index of 22 means an author has 22 papers cited 22 or more times
The h-index can grow as citations accumulate, and is therefore related to the experience, productivity, and academic age of a researcher (or journal, or research group, or whichever subject is being defined by the h-Index).
All these platforms have different journal coverage, measure citation activity differently and present it in slightly different ways, therefore it is advisable to use multiple sources to compare and contrast the information, particularly when looking at Quartile Ranges of journals. For example, a journal in Q1 of Scopus might be in Q2 of the Web of Science.
Criteria for inclusion in these databases varies based on different aspects. The Core Collection databases of the Web of Science have the strictest criteria with the fewest journals indexed, then Scopus. Both these databases assess journals for standards of editorial process, website presentation, editorial and ethical policies and conduct, technical infrastructure and interoperability between other systems.
In addition, the citation profile of a journal is assessed to determine its place and value in a field. Their contributing authors and editorial boards are analysed, both internally within a journal and across the wider field. This network analysis is used to inform the unique contribution a journal makes, and whether the journal is of highly referenced importance to the field.
Google Scholar indexing criteria has no editorial and citation profiling criteria, and is based on technical accessibility for data-mining and web-crawling. This means that the journals, articles and sources indexed in Google Scholar are not as strictly curated as other databases, but it does mean that it includes more data for a wider range of sources, and therefore often displays higher citation counts.
As these metrics feature prominently in assessment criteria, journals often display these prominently too, usually on the homepage of the journal – particularly if their Impact Factor or metrics are high.
The journals in the stricter databases may be seen as having editorial processes of a high standard, and have successfully engaged the research communities of a subject area well enough that the journals are read and referenced. These metrics may serve as a kite-mark of reassurance of the standards with which your submission will be handled.
The metrics themselves can be subject to a great degree of change. Just one highly cited paper can make a significant difference to the Impact Factor (for example) of a journal, so looking at a single Impact Factor for one year is not enough to determine the overall stature of a journal.
By looking into their citation profile and Impact Factor over the previous years, you will get a better idea of the consistency of how a journal is used. Journals that consistently receive large numbers of citations are likely to be able to support the dissemination of your research to an audience of active researchers and authors in the field, which may be the audience you wish to reach.
The San Francisco Declaration of Research Assessment, referred to as DORA, the UK Research Excellence Framework, and other research assessment bodies caution against using journal citation metrics as a sole means of search (and assessment) evaluation. DORA, particularly, was established to “ensure that hiring, promotion, and funding decisions focus on the qualities of research that are most desirable – insight, impact, reliability and re-usability – rather than on questionable proxies” (statement from DORA Roadmap, June 27, 2018).
A high Impact Factor alone may not give you enough information to understand whether the journal is the most appropriate place to publish your work. As our journal selection guide explains, there are many other important features to consider that may be of more value to you.
In our section dedicated to predatory publishing, we go into detail about the ways that metrics and databases are being used in fraudulent and deceptive ways, but as a final note in this current module, we would like to briefly refer to predatory publishing, and avoiding deceptive publishers.
If the journal claims to be indexed in a particular database, such as Web of Science or Scopus, can you verify this is the case by searching and finding them? The master lists of journals indexed in both these platforms are freely accessible. It is good practice to check that a journal is genuinely indexed in one of these platforms if it claims to be.
Google Scholar works as a helpful free resource to check the citations of unfamiliar journals which claim to have high Impact Factors. Drill down into the citation counts of papers to see where their citations come from. In less reputable journals, you may find many of these citations come from the same journal, which indicates some unethical practices.
Citation metrics and their databases can give some valuable reassurance of the quality of a journal, and provide some insights into the audience and potential impact your article may have.